Fig. 10
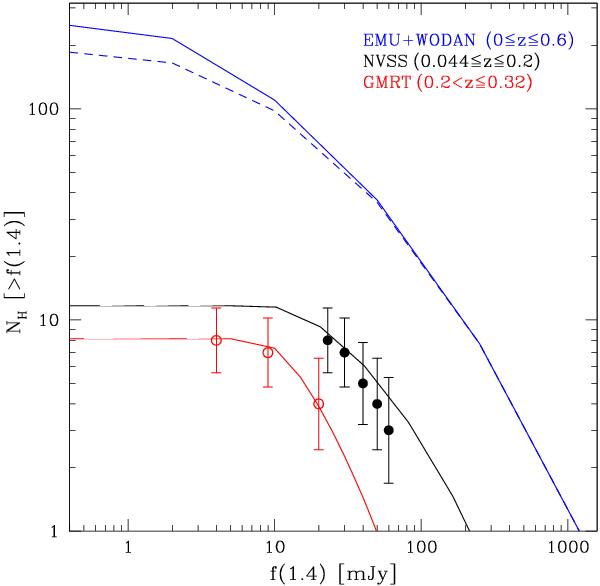
All-sky number distribution of radio halos within z < 0.6 as a function of the radio flux at 1.4 GHz as expected in the EMU+WODAN surveys (blue upper lines). For comparison, in the same figure, the expected distribution of radio halos in the redshift range 0.044 < z < 0.2, compared with that observed in the NVSS (black lines and filled dots) and in the redshift range 0.2 < z < 0.32 compared with that observed in the “GMRT RH Survey” (red lines and open dots) are also reported. The blue dashed line shows the distribution of turbulent generated halos.
Current usage metrics show cumulative count of Article Views (full-text article views including HTML views, PDF and ePub downloads, according to the available data) and Abstracts Views on Vision4Press platform.
Data correspond to usage on the plateform after 2015. The current usage metrics is available 48-96 hours after online publication and is updated daily on week days.
Initial download of the metrics may take a while.