Fig. 11
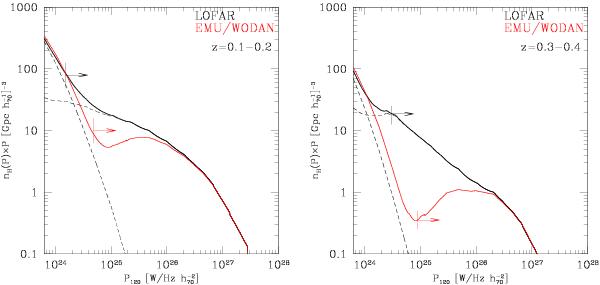
RHLF of halos with νs ≥ 120 MHz (black solid lines) and that of halos with νs > 1000 MHz (red lower lines) in two different redshift ranges z = 0.1−0.2 (left panel) and z = 0.3−0.4 (right panel). As an example, dashed lines (in both panels) show the individual contributions of “turbulent” radio halos and “off-state” halos to the LOFAR RHLF. The black and red arrows show the LOFAR and EMU+WODAN sensitivities, respectively, at the considered redshifts.
Current usage metrics show cumulative count of Article Views (full-text article views including HTML views, PDF and ePub downloads, according to the available data) and Abstracts Views on Vision4Press platform.
Data correspond to usage on the plateform after 2015. The current usage metrics is available 48-96 hours after online publication and is updated daily on week days.
Initial download of the metrics may take a while.