Fig. 2
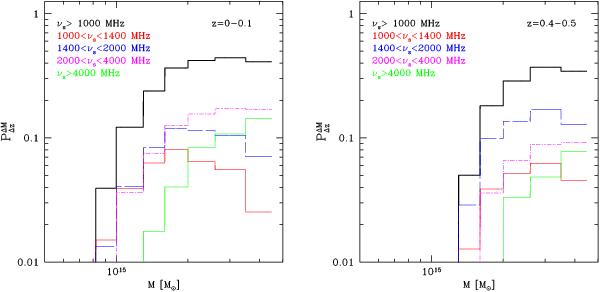
Fraction of clusters with radio halos with νs ≥ 1000 MHz (black, upper, solid lines) as a function of the cluster mass in the redshift range 0−0.1 (left panel) and 0.4−0.5 (right panel). The fractions of clusters with radio halos with νs in different frequency ranges are also shown: 1000 < νs < 1400 MHz (red lines), 1400 < νs < 2000 MHz (blue lines), 2000 < νs < 4000 MHz (magenta lines), and ν > 4000 MHz (green lines).
Current usage metrics show cumulative count of Article Views (full-text article views including HTML views, PDF and ePub downloads, according to the available data) and Abstracts Views on Vision4Press platform.
Data correspond to usage on the plateform after 2015. The current usage metrics is available 48-96 hours after online publication and is updated daily on week days.
Initial download of the metrics may take a while.