Fig. 3
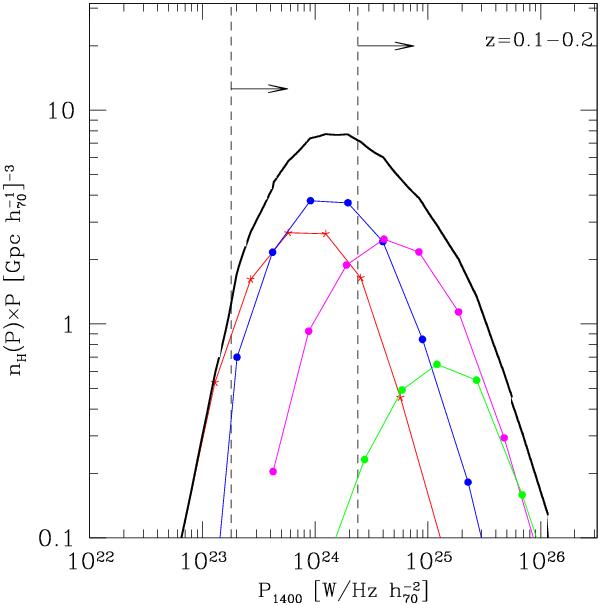
Radio halo luminosity function at νo = 1400 MHz (black lines) for clusters at redshift 0.1−0.2. The contributions from halos with νs in different frequency ranges are also shown: 1000 < νs < 1400 MHz (red lines), 1400 < νs < 2000 MHz (blue lines), 2000 < νs < 4000 MHz (magenta lines), and ν > 4000 MHz (green lines). The dashed lines correspond to the minimum detectable radio halo power (according to Eq. (9) with ξ1 = 3, see text for details) for EMU + WODAN survey and for the NVSS (from left to right).
Current usage metrics show cumulative count of Article Views (full-text article views including HTML views, PDF and ePub downloads, according to the available data) and Abstracts Views on Vision4Press platform.
Data correspond to usage on the plateform after 2015. The current usage metrics is available 48-96 hours after online publication and is updated daily on week days.
Initial download of the metrics may take a while.