Fig. 7
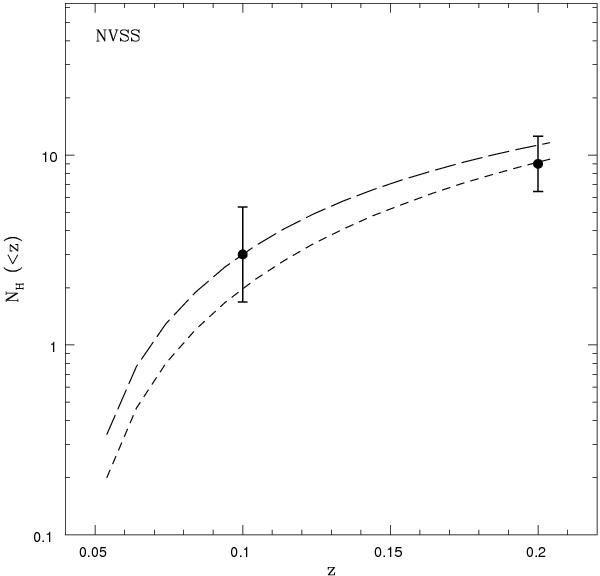
Integrated number of radio halos within a given redshift expected in the NVSS follow-up of the XBACS clusters (dashed line) compared with the observed values (black points) within z = 0.1 and z = 0.2 taken from Giovannini et al. (1999). The expected numbers of halos are computed by consider fmin(z) given by Eq. (9) with ξ1 = 3 (short dashed line), and by Eq. (11) with ξ2 = 10 (long dashed line).
Current usage metrics show cumulative count of Article Views (full-text article views including HTML views, PDF and ePub downloads, according to the available data) and Abstracts Views on Vision4Press platform.
Data correspond to usage on the plateform after 2015. The current usage metrics is available 48-96 hours after online publication and is updated daily on week days.
Initial download of the metrics may take a while.