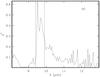
Fig. 8
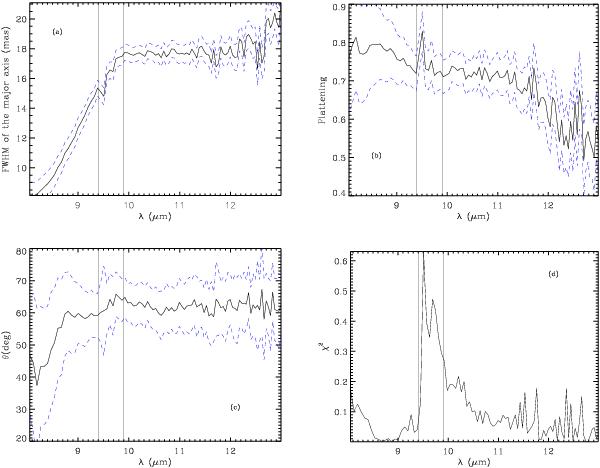
The parameters provided by the best model, obtained by fitting an elliptical Gaussian distribution to MIDI visibilities, as a function of wavelength: a) the FWHM of the major axis; b) the flattening (ratio of the FWHM of the minor axis to that of the major axis); c) the projection of the major axis (θ) on the sky plane; and d) the χ2 for each wavelength. The dashed lines indicate the errors for each parameter as a function of the wavelength. The vertical solid lines represent the atmospheric ozone band.
Current usage metrics show cumulative count of Article Views (full-text article views including HTML views, PDF and ePub downloads, according to the available data) and Abstracts Views on Vision4Press platform.
Data correspond to usage on the plateform after 2015. The current usage metrics is available 48-96 hours after online publication and is updated daily on week days.
Initial download of the metrics may take a while.