Fig. 4
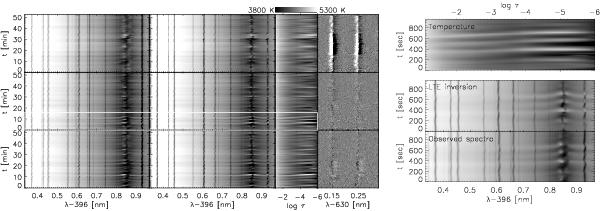
Comparison of observed spectra and inversion results in the time series. Left panel, top to bottom: spectra from three different locations along the slit versus (vs.) time. The upper row corresponds to a network location. First column: observed spectra. Second column: best-fit spectra. The third column shows the temperature stratifications vs. log τ, the fourth column the simultaneous Stokes V spectra of the 630 nm channel. The white rectangle in the second row marks the section shown magnified on the right-hand side. A train of three consecutive brightenings passes from the line wing towards the line core between t = 300 s and t = 800 s.
Current usage metrics show cumulative count of Article Views (full-text article views including HTML views, PDF and ePub downloads, according to the available data) and Abstracts Views on Vision4Press platform.
Data correspond to usage on the plateform after 2015. The current usage metrics is available 48-96 hours after online publication and is updated daily on week days.
Initial download of the metrics may take a while.