Fig. 8
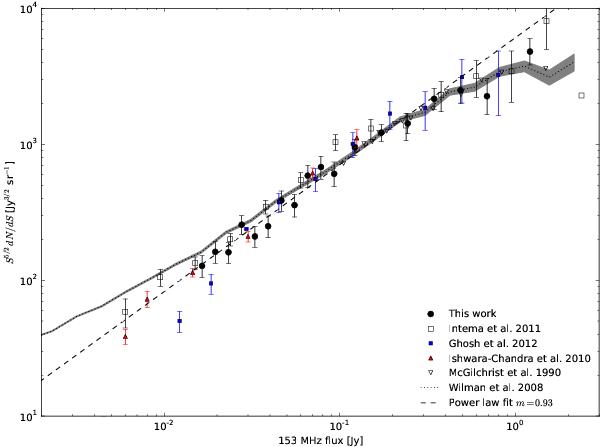
Euclidean-normalised differential source counts for the GMRT 153 MHz catalogue (filled black circles) in 18 logarithmic flux density bins between 15 mJy and 6.5 Jy. For comparison we have plotted the 153 MHz source counts from Intema et al. (2011) (open squares) for the central Böotes pointing, from Ghosh et al. (2012) (blue filled squares) and from Ishwara-Chandra et al. (2010) (red filled triangles), as well as the 151 MHz source counts from McGilchrist et al. (1990) for part of the 7C catalogue (open inverted triangles). Also shown is a source count model by Wilman et al. (2008) (dotted line with shaded area indicating the 1σ errors) and a power law fitted between 150−400 mJy (dashed line) which has a slope of 0.93 ± 0.04.
Current usage metrics show cumulative count of Article Views (full-text article views including HTML views, PDF and ePub downloads, according to the available data) and Abstracts Views on Vision4Press platform.
Data correspond to usage on the plateform after 2015. The current usage metrics is available 48-96 hours after online publication and is updated daily on week days.
Initial download of the metrics may take a while.