Fig. 4
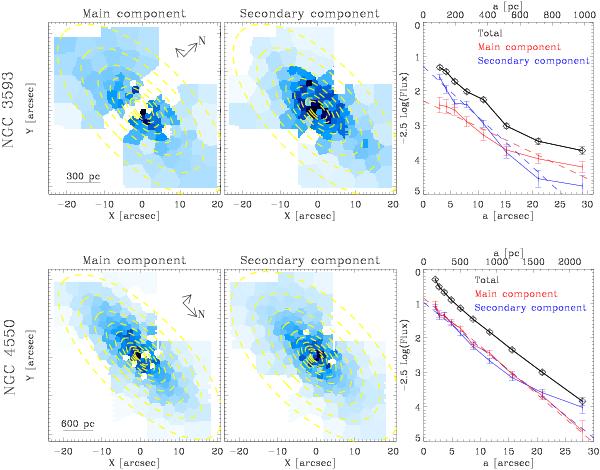
Maps (left and central panel) and radial profiles (right panels) of the surface brightness of the main and the secondary stellar components of NGC 3593 (upper panels) and NGC 4550 (lower panels). Scale and orientation of the maps are given in the left panels. The black, red, and blue solid lines correspond to the total surface brightness and to the surface brightness of the main and the secondary stellar components, respectively. The dashed red and dashed blue lines correspond to the best-fitting exponential disks to the surface brightness of the main and secondary stellar components, respectively. Dashed ellipses represent the boundaries of the elliptical annuli where the median surface brightnesses were computed.
Current usage metrics show cumulative count of Article Views (full-text article views including HTML views, PDF and ePub downloads, according to the available data) and Abstracts Views on Vision4Press platform.
Data correspond to usage on the plateform after 2015. The current usage metrics is available 48-96 hours after online publication and is updated daily on week days.
Initial download of the metrics may take a while.