Fig. 7
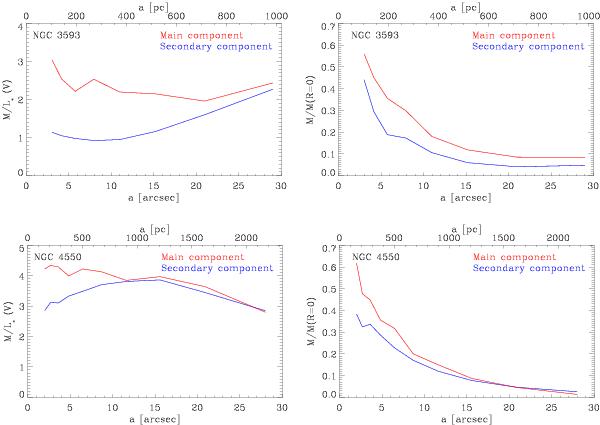
Radial profiles of the mass-to-light ratio in the V band (left panels) and mass surface density profiles relative to the central value (right panels) for NGC 3593 (upper panels) and NGC 4550 (lower panels). Red and blue lines refer to the main and the secondary stellar components, respectively. The x-axis displays the semi-major axis of the ellipses shown in Fig. 4.
Current usage metrics show cumulative count of Article Views (full-text article views including HTML views, PDF and ePub downloads, according to the available data) and Abstracts Views on Vision4Press platform.
Data correspond to usage on the plateform after 2015. The current usage metrics is available 48-96 hours after online publication and is updated daily on week days.
Initial download of the metrics may take a while.