Fig. 2
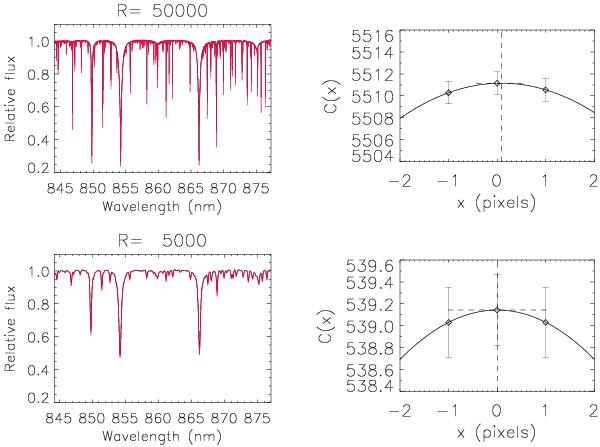
Spectra for a single snapshot of model d3t59g45mm00n01 (black) and its 1D counterpart (black), with near solar atmospheric parameters, are shown in the left-hand panels for two different values of the resolving power (R). The right-hand panels illustrate how the corresponding shifts (1D relative to 3D) are obtained by fitting the peak of the cross-correlation function with a parabola.
Current usage metrics show cumulative count of Article Views (full-text article views including HTML views, PDF and ePub downloads, according to the available data) and Abstracts Views on Vision4Press platform.
Data correspond to usage on the plateform after 2015. The current usage metrics is available 48-96 hours after online publication and is updated daily on week days.
Initial download of the metrics may take a while.