Fig. 9
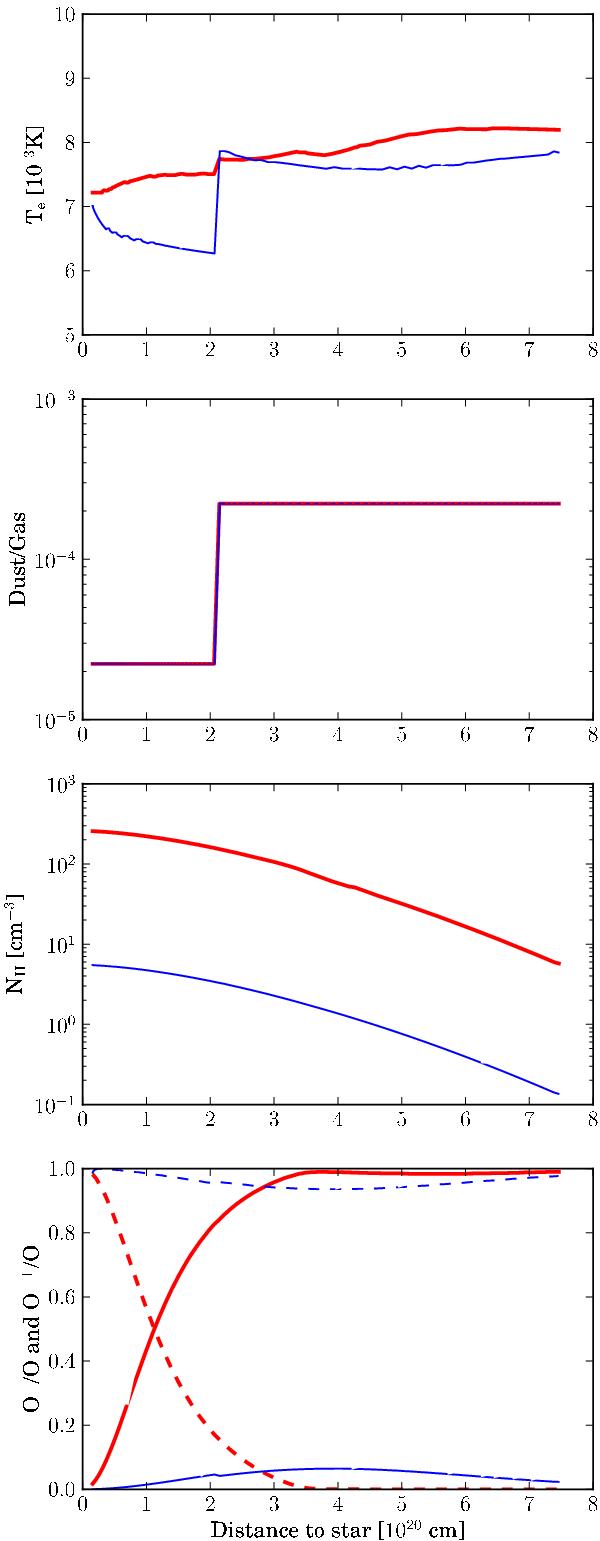
Radial distribution of the electron temperature, the dust-to-gas ratio, the hydrogen density, and the relative abundances of O+ (dashed curve) and O++ (continuous curve). The thick red curves correspond to Model M1 (or the high-density component of model M2) while the thin blue curves correspond to the low density component of model 2.
Current usage metrics show cumulative count of Article Views (full-text article views including HTML views, PDF and ePub downloads, according to the available data) and Abstracts Views on Vision4Press platform.
Data correspond to usage on the plateform after 2015. The current usage metrics is available 48-96 hours after online publication and is updated daily on week days.
Initial download of the metrics may take a while.