Fig. 1
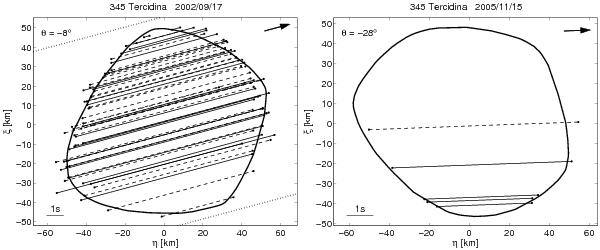
Two observations of star occultations by asteroid (345) Tercidina. The solid contour corresponds to a scaled projected silhouette of the shape model with the pole (346°, −55°), each chord represents one occultation observation (solid lines are CCD, video, or photoelectric observations; dashed lines are visual observations, and dotted lines negative observations). Each plot also contains the time scale (lower left corner), the latitude of the sub-Earth point θ for the time of occultation (upper left corner), and the direction of the relative velocity (the arrow in the upper right corner). East points to the left and north up.
Current usage metrics show cumulative count of Article Views (full-text article views including HTML views, PDF and ePub downloads, according to the available data) and Abstracts Views on Vision4Press platform.
Data correspond to usage on the plateform after 2015. The current usage metrics is available 48-96 hours after online publication and is updated daily on week days.
Initial download of the metrics may take a while.