Free Access
Fig. 6
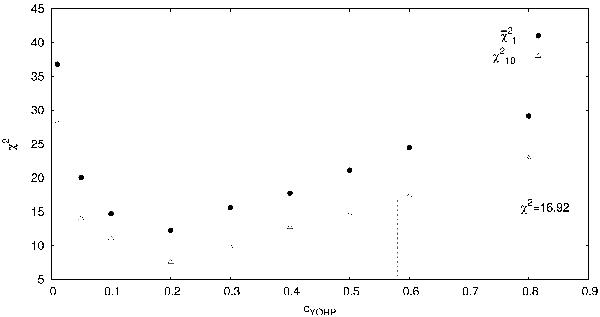
Dependence of  and
and  values calculated for the time t = 4 Gyr (i.e. the final state of the simulation) on different values of the cYORP parameter. We also plotted the statistically significant probability value of 5% which corresponds to χ2 = 16.92 and the interval of plausible cYORP values from 0.05 to 0.6.
Current usage metrics show cumulative count of Article Views (full-text article views including HTML views, PDF and ePub downloads, according to the available data) and Abstracts Views on Vision4Press platform.
Data correspond to usage on the plateform after 2015. The current usage metrics is available 48-96 hours after online publication and is updated daily on week days.
Initial download of the metrics may take a while.