Fig. 1
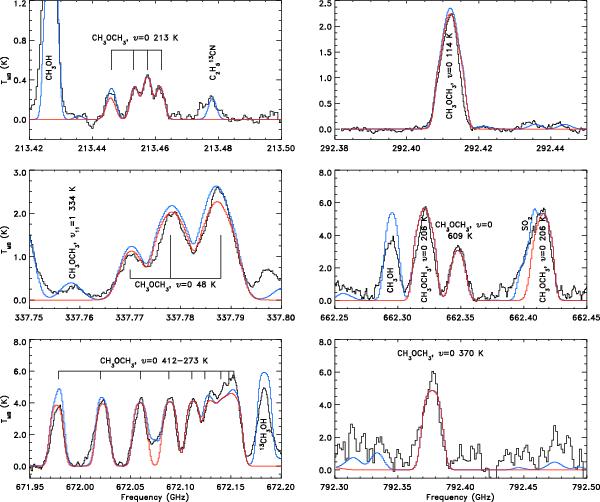
Selected emission lines for ground-state CH3OCH3, ν= 0, in all atmospheric windows. The observed spectrum is displayed in black, the myXCLASS isothermal model for CH3OCH3, ν= 0, in red and the myXCLASS isothermal model for all assigned species in blue. The major transitions of CH3OCH3, ν= 0, and other detected species are indicated in the plot as well as the values for Eu for the transitions of CH3OCH3, ν= 0.
Current usage metrics show cumulative count of Article Views (full-text article views including HTML views, PDF and ePub downloads, according to the available data) and Abstracts Views on Vision4Press platform.
Data correspond to usage on the plateform after 2015. The current usage metrics is available 48-96 hours after online publication and is updated daily on week days.
Initial download of the metrics may take a while.