Fig. 2
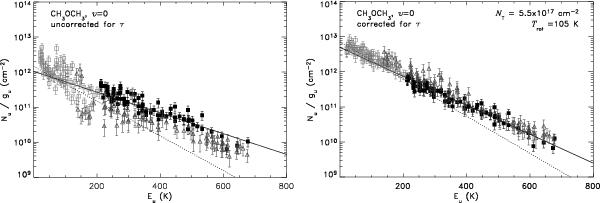
Rotational diagram for CH3OCH3, ν= 0, uncorrected for the predicted optical depth (left) and corrected for the optical depth (right), in all other aspects the data is treated in the same way, as well as that the same symbols and line-styles are used in both panels. Line-emission from other species, derived from an isothermal model of all identified species minus dimethyl ether, has been subtracted from the dimethyl ether emission in both figures. The filled squares (■) indicate the lines with Eu > 200 K and open squares (Λ) lines with Eu < 200 K, detected with SHeFI in the 230, 290 and 345 GHz windows. The open triangles (△) indicate CHAMP+ data. The solid line shows the least squares-fit to the Eu > 200 K data and the dotted line the least-square fit to the Eu < 200 K transitions. The dust absorption has been corrected for. NT for the fit to the transitions with Eu > 200 K is 5.5 × 1017 cm-2 and Trot is 105 K for a source size of 2.6′′. For the transitions with Eu < 200 K these values are 5.0 × 1017 cm-2 and 82 K, respectively for a source size of 3.2′′.
Current usage metrics show cumulative count of Article Views (full-text article views including HTML views, PDF and ePub downloads, according to the available data) and Abstracts Views on Vision4Press platform.
Data correspond to usage on the plateform after 2015. The current usage metrics is available 48-96 hours after online publication and is updated daily on week days.
Initial download of the metrics may take a while.