Fig. 2
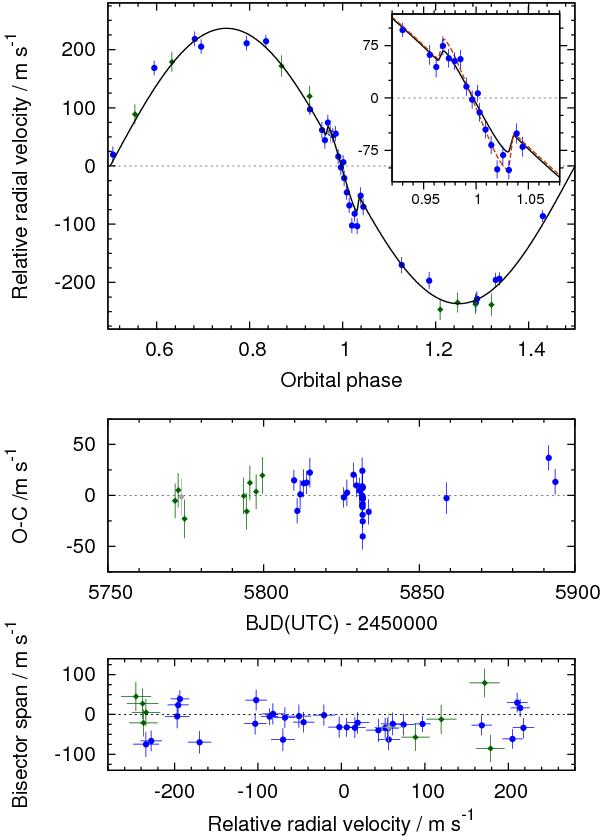
Radial velocities. Upper panel: phase-folded radial-velocity measurements from SOPHIE (green squares) and CORALIE (blue circles). The SOPHIE measurement that fell during transit and is excluded from our MCMC analysis is shown as a grey square. The centre-of-mass velocity, γ = −7.7941 km s-1, has been subtracted, as has the fitted offset γCOR−SOPH = 41.6 m s-1 between the two datasets. The best-fitting MCMC solution is over-plotted as a solid black line. Inset: a close up of the Rossiter-McLaughlin effect. In addition to the model plotted in the main panel, a second model where is not constrained with a prior is shown with a dashed orange line. Middle panel: residuals from the Keplerian and RM fit as a function of time. No significant linear trend is present in the residuals (the best-fitting linear radial acceleration is  m s-1 yr-1). Lower panel: bisector span measurements as a function of radial velocity. The uncertainties in the bisectors are taken to be twice the uncertainty in the radial velocities.
Current usage metrics show cumulative count of Article Views (full-text article views including HTML views, PDF and ePub downloads, according to the available data) and Abstracts Views on Vision4Press platform.
Data correspond to usage on the plateform after 2015. The current usage metrics is available 48-96 hours after online publication and is updated daily on week days.
Initial download of the metrics may take a while.