Fig. A.6
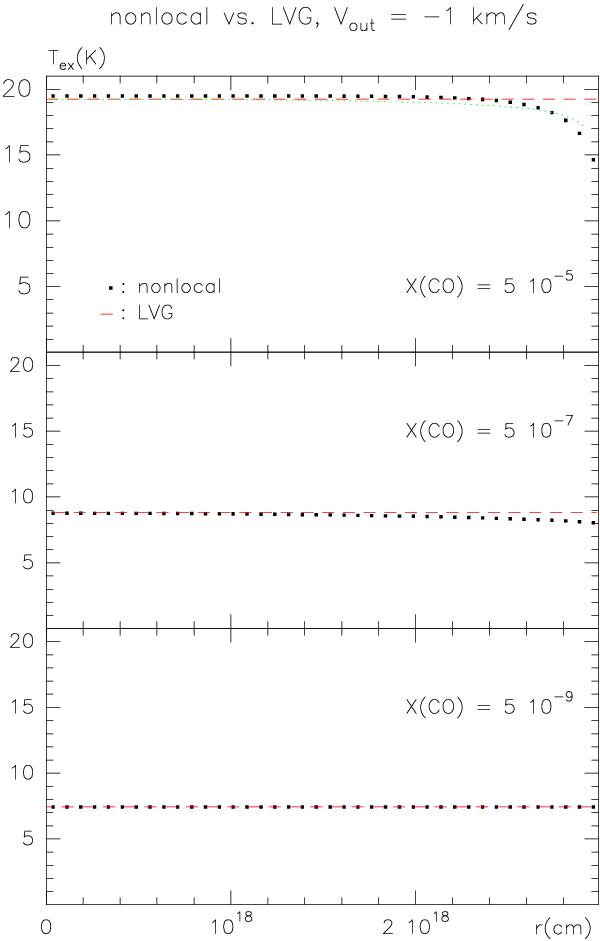
Comparison between calculations performed using our non-local treatment of radiative transfer (squares) and the LVG approximation for a cloud model similar to that used previously (from Bernes 1979) for different values of the relative CO abundance (which led to an optically thin case for X(CO) = 5 × 10⁻⁹, lower panel). The green dotted lines represent a modification of the LVG approach trying to simulate boundary effects.
Current usage metrics show cumulative count of Article Views (full-text article views including HTML views, PDF and ePub downloads, according to the available data) and Abstracts Views on Vision4Press platform.
Data correspond to usage on the plateform after 2015. The current usage metrics is available 48-96 hours after online publication and is updated daily on week days.
Initial download of the metrics may take a while.