Fig. A.5
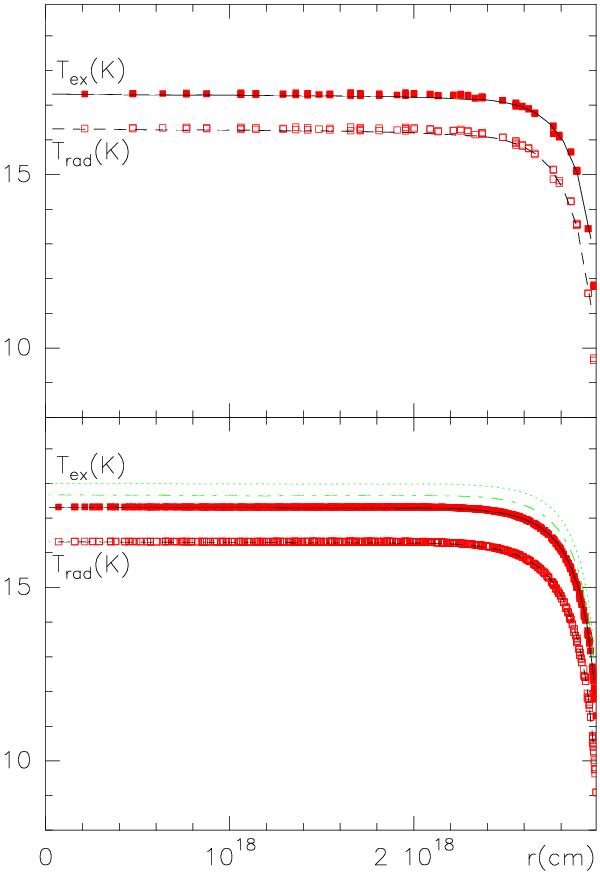
Calculations similar to those performed for Fig. A.4, but for a model cloud in which the highest inward velocity is equal to 4 km s-1. Upper panel: using 40 and 100 cells for the 1D and 2D calculations. Lower panel: using 75 and 900 cells; the green point and dash-point lines represent 1D calculations when more recent collisional rates are used (see text). Note the improvement in the calculation noise when more cells are used and the moderate influence of collisional rates.
Current usage metrics show cumulative count of Article Views (full-text article views including HTML views, PDF and ePub downloads, according to the available data) and Abstracts Views on Vision4Press platform.
Data correspond to usage on the plateform after 2015. The current usage metrics is available 48-96 hours after online publication and is updated daily on week days.
Initial download of the metrics may take a while.