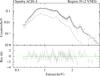
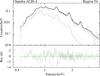
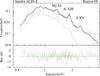
Fig. 5
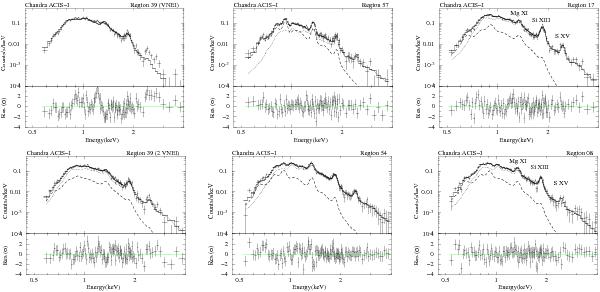
Left: Chandra ACIS-I spectrum of an interior region 39 with the best fit single-component VNEI model (upper diagram, reduced χ2 = 2.0 for 103 degrees of freedom) and two-component model (lower diagram, reduced χ2 = 1.1 for 100 degrees of freedom). Middle: spectrum of the outermost region 57 in the east (upper) and an interior region 54 (lower) with the best fit 2 VNEI model. The relative flux of the ejecta component (dotted) with respect to the ISM component (dashed) in region 57 is lower than in most other regions. Right: spectrum of region 17 with enhanced Si xiii emission (upper diagram). The Mg xi, Si xiii, and S xv triplets are marked. For comparison, the spectrum of region 08, which is the brightest region in the Lobe next to region 17, is shown (lower diagram). The best fit 2 VNEI model is additionally plotted in the diagrams.
Current usage metrics show cumulative count of Article Views (full-text article views including HTML views, PDF and ePub downloads, according to the available data) and Abstracts Views on Vision4Press platform.
Data correspond to usage on the plateform after 2015. The current usage metrics is available 48-96 hours after online publication and is updated daily on week days.
Initial download of the metrics may take a while.