Fig. 2
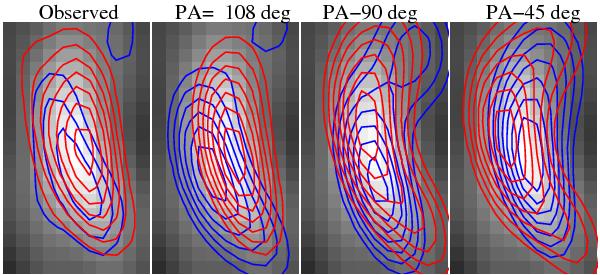
Left panel: observed velocity gradient. The grayscale image is a zoom into the CO(7–6) map shown in Fig. 1. The blue and red contours correspond to the CO(7–6) line emission integrated in the ranges [ − 135, − 15] and [ − 15,105] km s-1, respectively. The contours start at 3-σ and are spaced by σ = 104 mJy beam-1 km s-1. 2nd to 4th panels: Simulated velocity gradients with two lensed circular Gaussian sources of FWHM ρ = 120 mas, separated by 110 mas and with a position angle of 108, 18 and 63 deg, east from north, respectively (see Sect. 2.3).
Current usage metrics show cumulative count of Article Views (full-text article views including HTML views, PDF and ePub downloads, according to the available data) and Abstracts Views on Vision4Press platform.
Data correspond to usage on the plateform after 2015. The current usage metrics is available 48-96 hours after online publication and is updated daily on week days.
Initial download of the metrics may take a while.