Free Access
Fig. 3
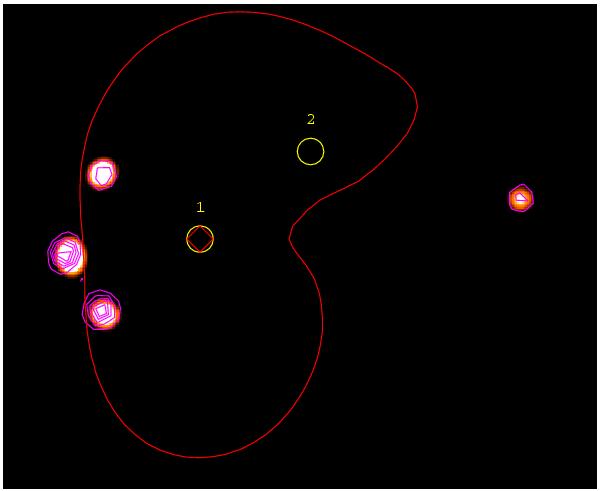
Four quasar images obtained with a lens model built following Kneib et al. (2000). The HST image is overlaid in magenta contours. The red lines represent the critical lines and the two yellow circles show the positions of the two lensing galaxies.
Current usage metrics show cumulative count of Article Views (full-text article views including HTML views, PDF and ePub downloads, according to the available data) and Abstracts Views on Vision4Press platform.
Data correspond to usage on the plateform after 2015. The current usage metrics is available 48-96 hours after online publication and is updated daily on week days.
Initial download of the metrics may take a while.