Fig. 6
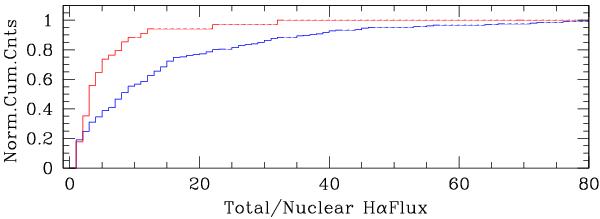
Cumulative distribution of the ratio of total Hα flux in the imaging material to the Hα flux measured in a central aperture of 10, 15, 30 or 45 arcsec diameter for galaxies of major axis 0–100, 100–200, 200–300 and >300 arcsec. The blue histogram refers to LTG-in ALFALFA with DefHI ≤ 0.3 and the red one includes LTGs with DefHI > 0.9 and LTGs undetected by ALFALFA.
Current usage metrics show cumulative count of Article Views (full-text article views including HTML views, PDF and ePub downloads, according to the available data) and Abstracts Views on Vision4Press platform.
Data correspond to usage on the plateform after 2015. The current usage metrics is available 48-96 hours after online publication and is updated daily on week days.
Initial download of the metrics may take a while.