Fig. 2
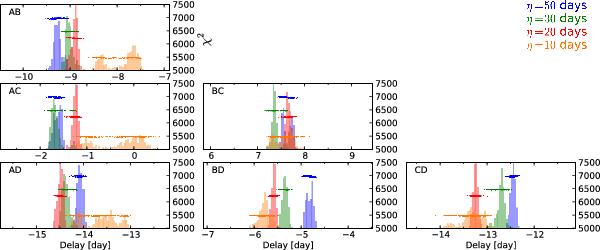
Distributions of time delays obtained by running the free-knot spline technique always on the same data, starting from randomized initial time shifts. The light curves are from Courbin et al. (2011), an excerpt of which is shown in Fig. 1. The colors encode the initial knot step η of the intrinsic spline, spanning a wide range corresponding to a factor 5 in the number of knots. Superposed on the histograms are scatter plots of the minimal χ2 values obtained by the optimization. We stress that the histograms shown here are not to be mistaken for probability density functions of time delay measurements on HE 0435-1223. They only illustrate the intrinsic variance, i.e., the finite precision of the optimization algorithm, as applied to a high-quality data set.
Current usage metrics show cumulative count of Article Views (full-text article views including HTML views, PDF and ePub downloads, according to the available data) and Abstracts Views on Vision4Press platform.
Data correspond to usage on the plateform after 2015. The current usage metrics is available 48-96 hours after online publication and is updated daily on week days.
Initial download of the metrics may take a while.