Fig. 3
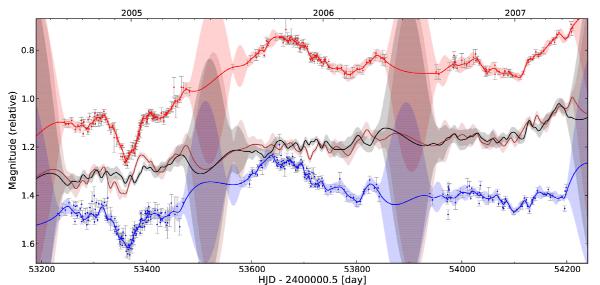
Illustration of the regression difference technique on light curves of HE 0435-1223 (Courbin et al. 2011). For clarity, only the light curves of images A (red) and B (blue) are shown. The Gaussian process regressions are shown as red and blue continuous mean functions and 1σ envelopes. Curve B has been shifted in time with respect to A to minimize the weighted total variation of the A − B difference curve, shown in black. The brown difference curve was obtained by deliberately shifting B by 15 days with respect to its optimal position. The curves have been arbitrarily offset in magnitudes for display purposes.
Current usage metrics show cumulative count of Article Views (full-text article views including HTML views, PDF and ePub downloads, according to the available data) and Abstracts Views on Vision4Press platform.
Data correspond to usage on the plateform after 2015. The current usage metrics is available 48-96 hours after online publication and is updated daily on week days.
Initial download of the metrics may take a while.