Fig. 4
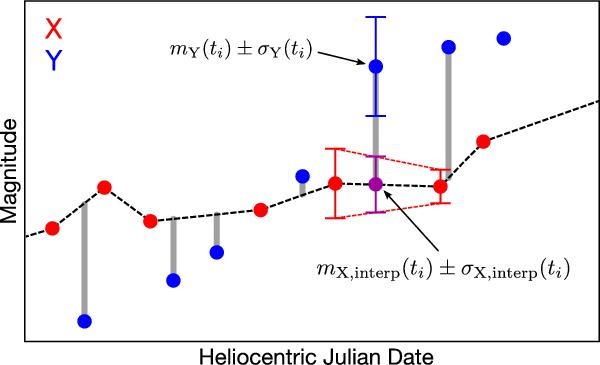
Illustration of the “elementary” dispersion function used in the curve-shifting technique described in Sect. 6. The vertical gray bars represent the terms of the summation of equation 6. The last shown point of light curve Y would not contribute to the dispersion, since it falls into a large gap of X. This elementary dispersion function is not invariant with respect to swapping the curves X and Y. However, our total dispersion estimate is symmetric, as we average these elementary dispersion across all permutations of 2 curves among n. Not shown in this sketch are the polynomial corrections for extrinsic variability. These corrections are optimized against the same total dispersion.
Current usage metrics show cumulative count of Article Views (full-text article views including HTML views, PDF and ePub downloads, according to the available data) and Abstracts Views on Vision4Press platform.
Data correspond to usage on the plateform after 2015. The current usage metrics is available 48-96 hours after online publication and is updated daily on week days.
Initial download of the metrics may take a while.