Fig. 5
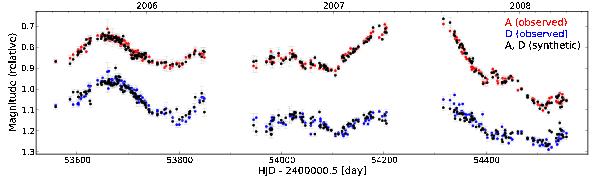
Synthetic curves (black) drawn from a well adjusted generative model (see text), and the corresponding observed data points for the lensed quasar HE 0435-1223. For illustration purposes only 3 seasons of 2 quasar images are shown, arbitrarily offset in magnitude. The purpose of the generative model is to simulate curves with known time delays that nevertheless mimic the observations at best.
Current usage metrics show cumulative count of Article Views (full-text article views including HTML views, PDF and ePub downloads, according to the available data) and Abstracts Views on Vision4Press platform.
Data correspond to usage on the plateform after 2015. The current usage metrics is available 48-96 hours after online publication and is updated daily on week days.
Initial download of the metrics may take a while.