Fig. 8
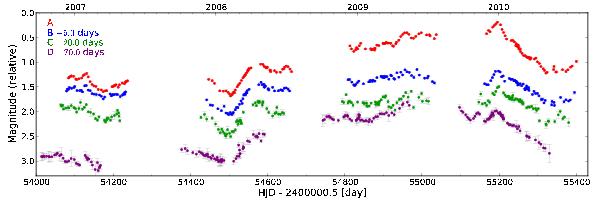
The “trial curves”, i.e., a set of artificial 4-season long light curves of a quad lens, used in place of real observations for the self-consistency check performed in Sect. 8. These curves are drawn from a generative model that closely mimics COSMOGRAIL observations. Note the prominent microlensing on large time scales, but also the presence of obviously extrinsic variability on scales of weeks (e.g., middle of third season of curve C). The true time delays are ΔtAB = −5.0, ΔtAC = −20.0, and ΔtAD = −70.0 days. In this figure the curves are shifted according to these delays.
Current usage metrics show cumulative count of Article Views (full-text article views including HTML views, PDF and ePub downloads, according to the available data) and Abstracts Views on Vision4Press platform.
Data correspond to usage on the plateform after 2015. The current usage metrics is available 48-96 hours after online publication and is updated daily on week days.
Initial download of the metrics may take a while.