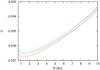
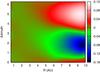
Fig. 4
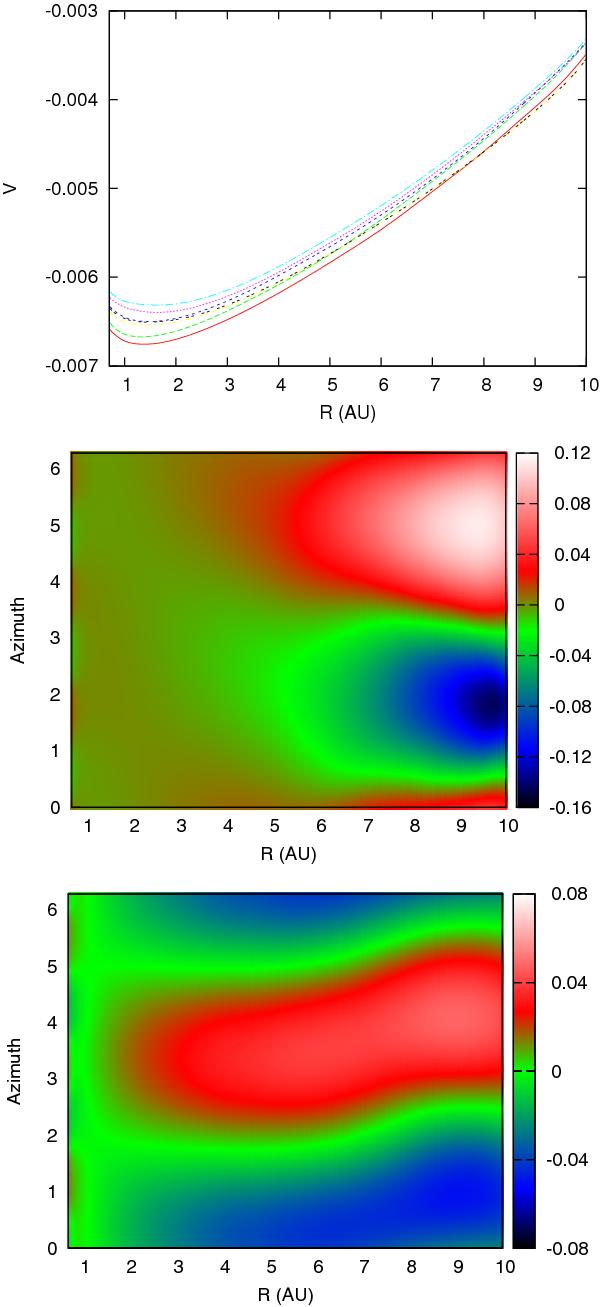
Azimuthally averaged radial profile of the disk potential (given in normalized units) at different evolutionary times sampled every 500 yrs. Some change in the potential is also due to the mass loss through the inner and outer borders of the computational grid. The two bottom plots illustrate the azimuthal variation, computed as  , at t = 2500 and t = 4000 yr, respectively. The azimuthal variation is not regular and depends on the evolutionary time.
Current usage metrics show cumulative count of Article Views (full-text article views including HTML views, PDF and ePub downloads, according to the available data) and Abstracts Views on Vision4Press platform.
Data correspond to usage on the plateform after 2015. The current usage metrics is available 48-96 hours after online publication and is updated daily on week days.
Initial download of the metrics may take a while.