Fig. 7
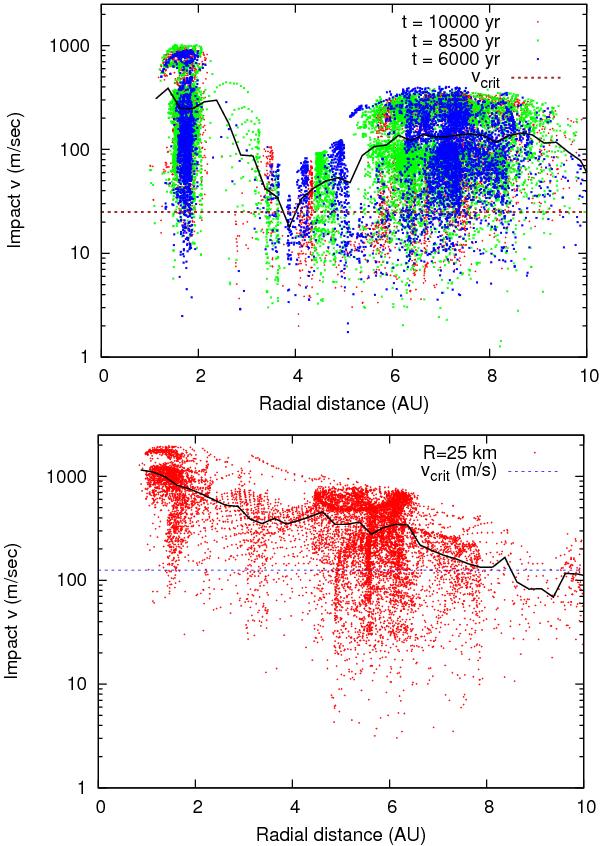
Relative encounter velocities between planetesimals. In panel 1 we compare the relative velocities in the case of small planetesimals at different times. There is a significant time variability in the impact velocity which, however, remains high all the time. In panel 2 we illustrate the relative velocities for R = 25 km planetesimals at t = 104 yr. The black lines in both plots show the average impact velocity computed in small radial bins The 2 horizontal lines display the limiting Δv values for the accretion/erosion frontier, as deduced from Leinhardt & Stewart (2012), for 5 km impactors and 25 km ones.
Current usage metrics show cumulative count of Article Views (full-text article views including HTML views, PDF and ePub downloads, according to the available data) and Abstracts Views on Vision4Press platform.
Data correspond to usage on the plateform after 2015. The current usage metrics is available 48-96 hours after online publication and is updated daily on week days.
Initial download of the metrics may take a while.