Fig. 4
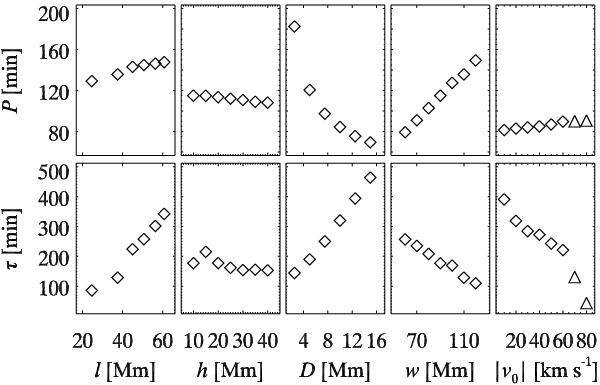
Scatter plots of the period P (upper panels) and damping time τ (lower panels) of the prominences in the oscillation step as functions of l, h, D, w, and v0. The values of P and τ in the cases | v0 | = 70 and 80 km s-1 that cause mass drainage at the footpoint of the coronal loop are marked with triangles in the right panels.
Current usage metrics show cumulative count of Article Views (full-text article views including HTML views, PDF and ePub downloads, according to the available data) and Abstracts Views on Vision4Press platform.
Data correspond to usage on the plateform after 2015. The current usage metrics is available 48-96 hours after online publication and is updated daily on week days.
Initial download of the metrics may take a while.