Fig. 6
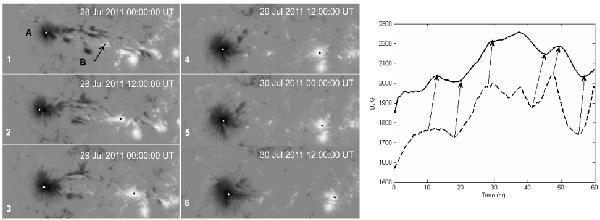
Sunspot group dynamics during the formation stage. Left panel: HMI intensitygrams of the active region NOAA 11260 with two sunspots (A and B). The XY coordinates are reverced. The frames obtained in period of 2011 Jul. 28–2011 Jul. 30. The active region field-of-view is [200″ × 100″]. The active region center coordinates are [−278″ × 209″] obtained at 20:00 UT on 2011 Jul. 28. The arrow in the first frame shows the small magnetic element, which is actively developing in time. Right panel: time series of the magnetic field strength (absolute maximum values) obtained from the magnetograms of the spot A (solid line) and the spot B (dashed line). Arrows show the quasi-regular delay between the variations. The time series start at 00:00 UT on 2011 Jul. 28.
Current usage metrics show cumulative count of Article Views (full-text article views including HTML views, PDF and ePub downloads, according to the available data) and Abstracts Views on Vision4Press platform.
Data correspond to usage on the plateform after 2015. The current usage metrics is available 48-96 hours after online publication and is updated daily on week days.
Initial download of the metrics may take a while.