Free Access
Fig. 1
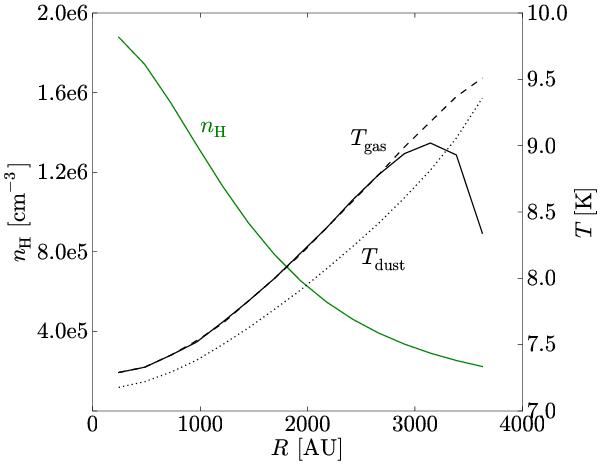
Density (green solid line) and temperature (black lines) profiles of the model core. The solid and dashed black lines correspond to the gas temperature at t = 105 and t = 106 years, respectively (see also Sipilä 2012). The dotted line represents the dust temperature.
Current usage metrics show cumulative count of Article Views (full-text article views including HTML views, PDF and ePub downloads, according to the available data) and Abstracts Views on Vision4Press platform.
Data correspond to usage on the plateform after 2015. The current usage metrics is available 48-96 hours after online publication and is updated daily on week days.
Initial download of the metrics may take a while.