Fig. 2
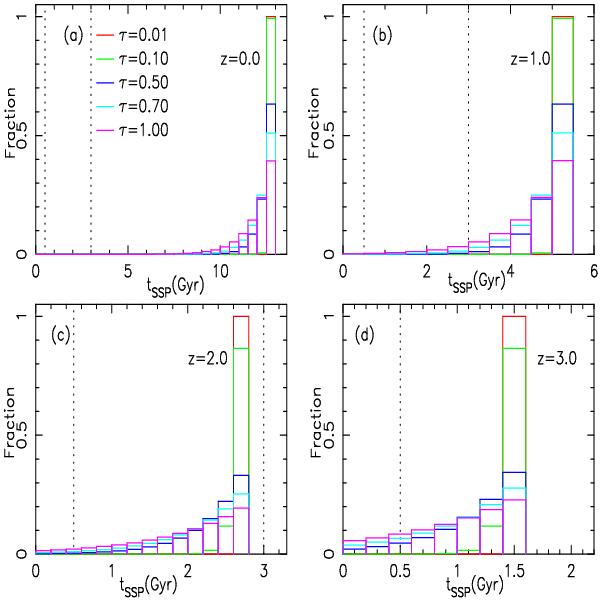
Age distribution of stellar populations in passive galaxies at different redshifts. Different colors of solid line represent the galaxy with different e −folding time scales τ (τ = 0.01,0.10,0.50,0.70, and 1.0 Gyr). The vertical dotted lines in each panel represent the lower and upper age limits for the age of 0.5 and 3.0 Gyr, which are obvious for the binary interactions.
Current usage metrics show cumulative count of Article Views (full-text article views including HTML views, PDF and ePub downloads, according to the available data) and Abstracts Views on Vision4Press platform.
Data correspond to usage on the plateform after 2015. The current usage metrics is available 48-96 hours after online publication and is updated daily on week days.
Initial download of the metrics may take a while.