Fig. 1
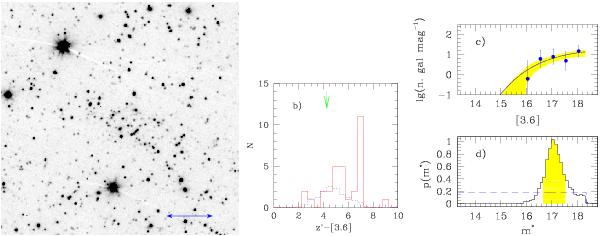
Left panel: [3.6] image of JKCS 041. The field of view is 5 × 5 arcmin, the ruler is 1 arcmin wide. North is up, east to the left. Central panel: color distribution in the cluster line-of-sight (solid red histogram) and in the control field direction (blue dashed histogram). The arrow indicates the expected color of a Grasil young star-forming galaxy (green arrow) at the cluster redshift. Top-right panel: luminosity function. The points marks the LF as usually derived in the astronomical literature, whereas the continuous (blue) curve and the shaded area mark the LF and its 68% errors based on our Bayesian analysis. The fit is performed on unbinned data, not on the binned data plotted in this figure. Bottom-right panel: probability distribution of m∗. The shortest 68% interval is shaded. The dashed line indicates the assumed prior.
Current usage metrics show cumulative count of Article Views (full-text article views including HTML views, PDF and ePub downloads, according to the available data) and Abstracts Views on Vision4Press platform.
Data correspond to usage on the plateform after 2015. The current usage metrics is available 48-96 hours after online publication and is updated daily on week days.
Initial download of the metrics may take a while.