Free Access
Fig. 3
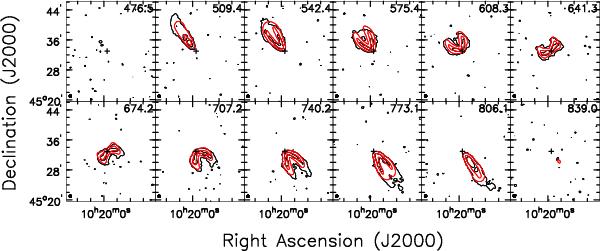
Channels maps of NGC 3198: observed (black) and modelled (red), using the rotation curve and inclination parameters from de Blok et al. (2008). Symbols are the same as Fig. 1. For better readability we have plotted fewer contours: −0.5, 0.5 (2.5σ), and 20 mJy beam-1. Also, compared to Fig. 1, fewer channels are shown.
Current usage metrics show cumulative count of Article Views (full-text article views including HTML views, PDF and ePub downloads, according to the available data) and Abstracts Views on Vision4Press platform.
Data correspond to usage on the plateform after 2015. The current usage metrics is available 48-96 hours after online publication and is updated daily on week days.
Initial download of the metrics may take a while.