Fig. 3
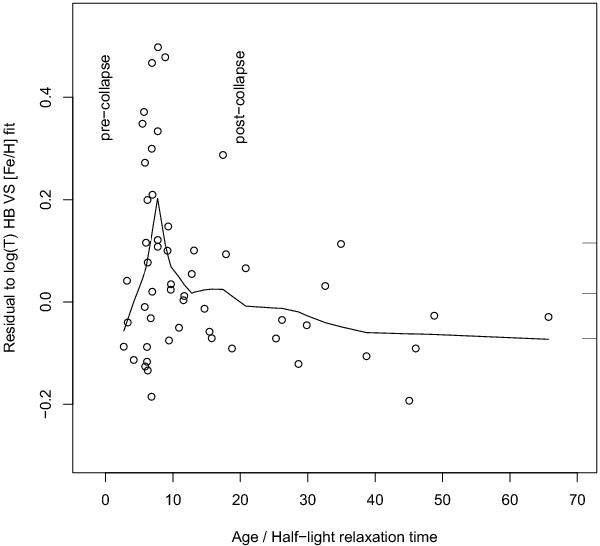
Residuals to the local polynomial regression plotted in Fig. 1 (solid line in that figure) as a function of GC age to relaxation-time ratio. Core-collapse is found to occur for a ratio of about 5 to 10 depending on the mass spectrum and initial concentration (see simulations in the following). The superimposed local polynomial regression line (dashed) shows a peak in this age range. For comparison, the ticks on the vertical axis at the right side of the plot show (from bottom to top) the first quartile, the median, and the third quartile of the distribution of residuals.
Current usage metrics show cumulative count of Article Views (full-text article views including HTML views, PDF and ePub downloads, according to the available data) and Abstracts Views on Vision4Press platform.
Data correspond to usage on the plateform after 2015. The current usage metrics is available 48-96 hours after online publication and is updated daily on week days.
Initial download of the metrics may take a while.