Fig. 7
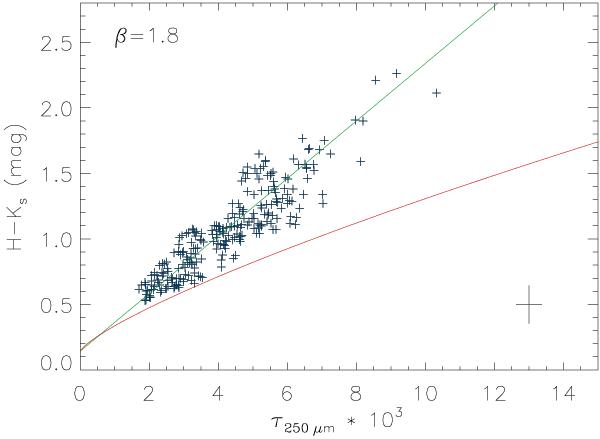
H − K colours of the background stars as a function
τ250 μm from Herschel
assuming a dust emissivity index of β = 1.8. A linear fit to
the data points is shown with a green line. The red curve shows the relationship
implied by the dependence of  on
NH found in Orion A by Roy et al. (2013). The mean error of the data points is indicated with a
cross in the bottom right.
on
NH found in Orion A by Roy et al. (2013). The mean error of the data points is indicated with a
cross in the bottom right.
Current usage metrics show cumulative count of Article Views (full-text article views including HTML views, PDF and ePub downloads, according to the available data) and Abstracts Views on Vision4Press platform.
Data correspond to usage on the plateform after 2015. The current usage metrics is available 48-96 hours after online publication and is updated daily on week days.
Initial download of the metrics may take a while.