Fig. 1
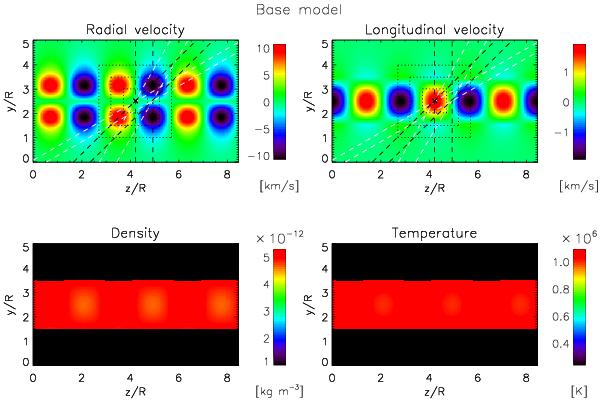
Maps of radial velocity (top-left), longitudinal velocity (top-right), density (bottom-left), and temperature (bottom-right) along the middle of the cylinder for the base model − 171 (see Sect. 2.4 for more details). The snapshot is taken at one-third of the mode period. The black and white dashed lines in the top panels denote the 4 different line-of-sight angles considered: 0°,30°,45°, and 60°. For each angle two rays along the line-of-sight are plotted, one passing through a node of the radial velocity (left ray of the pair) and one passing through an anti-node of the same quantity (right ray of the pair). The different pixel sizes considered are shown centred at a node: “0R” (=25 km), “1R” = 1 Mm, “2R” = 2 Mm, “3R” = 3 Mm. In the base model, 1R, 2R, and 3R correspond roughly to ℓ/3,2ℓ/3, and ℓ, respectively, where ℓ denotes the wavelength of the mode.
Current usage metrics show cumulative count of Article Views (full-text article views including HTML views, PDF and ePub downloads, according to the available data) and Abstracts Views on Vision4Press platform.
Data correspond to usage on the plateform after 2015. The current usage metrics is available 48-96 hours after online publication and is updated daily on week days.
Initial download of the metrics may take a while.