Fig. 4
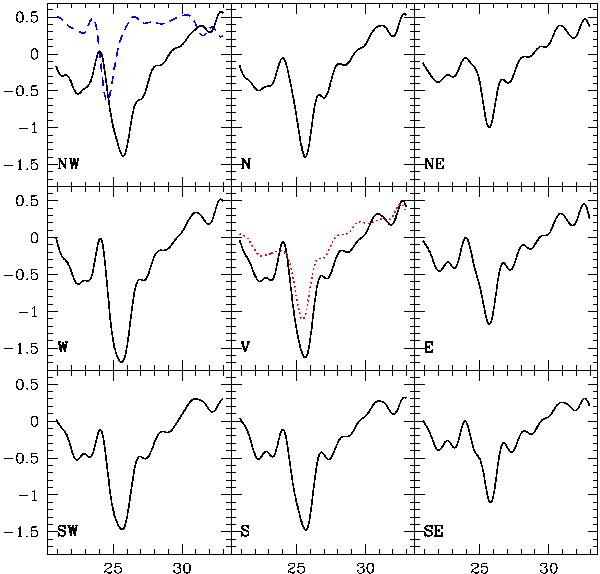
Muon flux along the nine directions is shown for the FD on 2001 November 24. The fluxes are shown as percentage deviations from mean values. The solid black lines show the data after applying a low-pass filter (S09). The blue dashed line in the first panel shows the magnetic field observed in-situ by spacecraft. The magnetic field data are inverted (i.e., magnetic field peaks appear as troughs) and are scaled to fit in the panel. The red dotted line in the middle panel shows Tibet neutron monitor data scaled down by a factor of 3 to fit in the panel.
Current usage metrics show cumulative count of Article Views (full-text article views including HTML views, PDF and ePub downloads, according to the available data) and Abstracts Views on Vision4Press platform.
Data correspond to usage on the plateform after 2015. The current usage metrics is available 48-96 hours after online publication and is updated daily on week days.
Initial download of the metrics may take a while.