Fig. 5
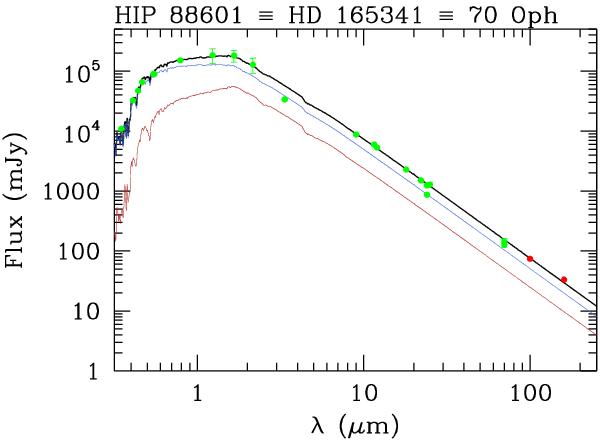
Spectral energy distribution of the non-excess star HIP 88601. Plotted are optical, near-IR, WISE, and Spitzer MIPS (green symbols), as well as the PACS 100 μm and 160 μm (red symbols) fluxes. The photospheric fits of each individual component together with the added contribution of both stars (black) are shown as continuous lines.
Current usage metrics show cumulative count of Article Views (full-text article views including HTML views, PDF and ePub downloads, according to the available data) and Abstracts Views on Vision4Press platform.
Data correspond to usage on the plateform after 2015. The current usage metrics is available 48-96 hours after online publication and is updated daily on week days.
Initial download of the metrics may take a while.