Fig. 3
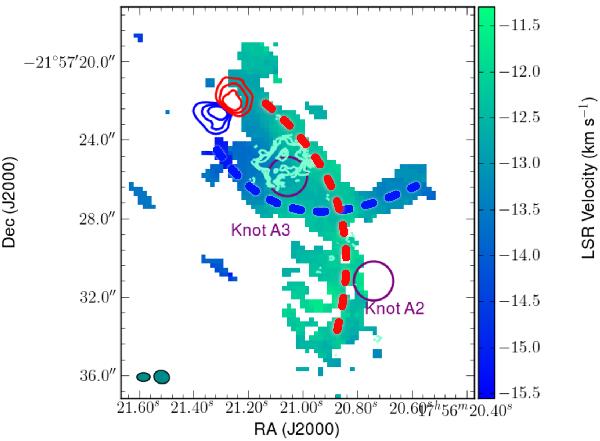
CO J = 2–1 intensity weighted velocity map of the blue shifted wind from HD 163296. The purple circles show the 2012 positions of the knots, the blue and red contours show the HCO+J = 4–3 emission, and the two dark cyan circles in the bottom left corner show the synthesized beams of the observations, as in Fig. 2. The blue and red dashed lines delineate the double corkscrew described in the text.
Current usage metrics show cumulative count of Article Views (full-text article views including HTML views, PDF and ePub downloads, according to the available data) and Abstracts Views on Vision4Press platform.
Data correspond to usage on the plateform after 2015. The current usage metrics is available 48-96 hours after online publication and is updated daily on week days.
Initial download of the metrics may take a while.