Free Access
Fig. 3
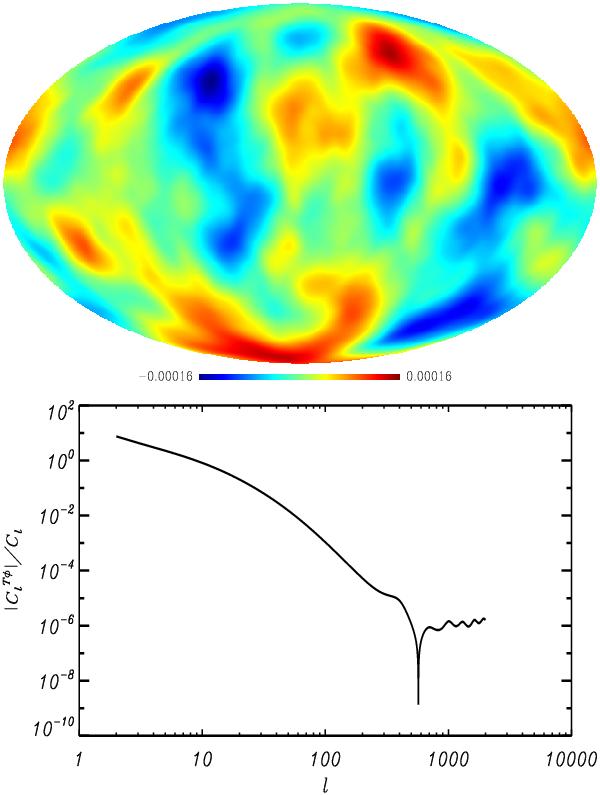
Large-scale contribution to the non-Gaussian L-ISW signal. Upper
panel: the map 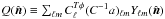 contains the L-ISW coefficients
  and enters the
L-ISW estimator Eq. (18). The
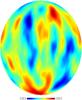
ℓ-filter
and enters the
L-ISW estimator Eq. (18). The
ℓ-filter  acts as a filter that suppresses the small scales (lower panel).
This figure is made of several images, please see below:
Current usage metrics show cumulative count of Article Views (full-text article views including HTML views, PDF and ePub downloads, according to the available data) and Abstracts Views on Vision4Press platform.
Data correspond to usage on the plateform after 2015. The current usage metrics is available 48-96 hours after online publication and is updated daily on week days.
Initial download of the metrics may take a while.