Free Access
Fig. 11
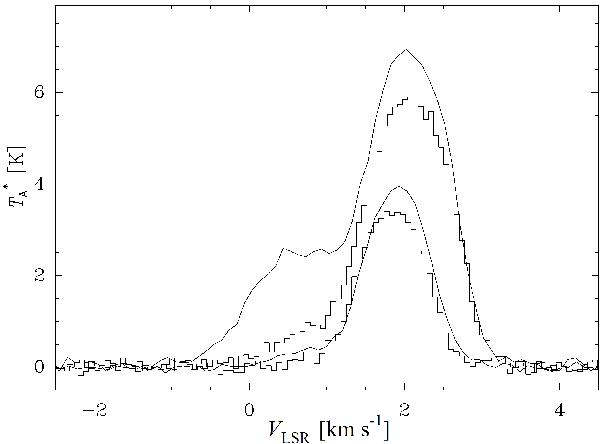
Line profiles obtained for the central position of RN 5 show a weak component, blue-shifted relative to the main component. The strongest lines are from 12CO and the weaker from 13CO. Lines from (2–1) transitions are drawn as curves, and from (3–2) transitions as histograms.
Current usage metrics show cumulative count of Article Views (full-text article views including HTML views, PDF and ePub downloads, according to the available data) and Abstracts Views on Vision4Press platform.
Data correspond to usage on the plateform after 2015. The current usage metrics is available 48-96 hours after online publication and is updated daily on week days.
Initial download of the metrics may take a while.