Fig. A.1
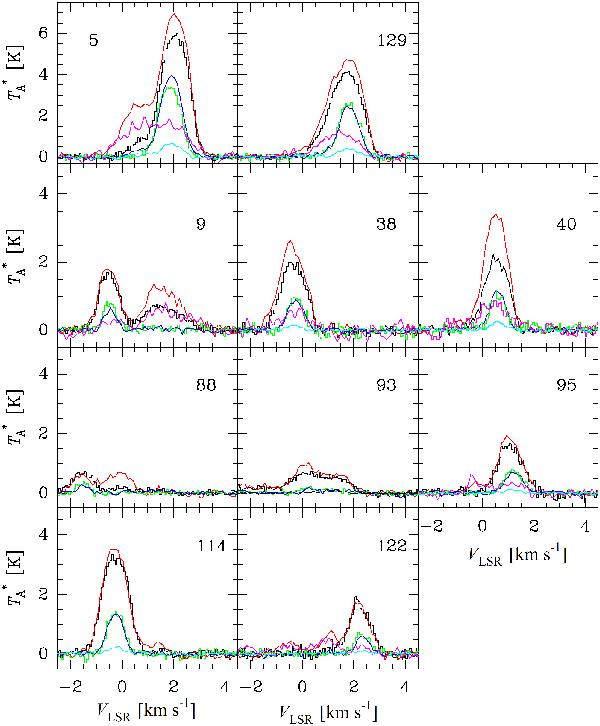
CO spectra obtained for on-source-positions of the globulettes observed at both
at APEX and Onsala in the  scale. The
  (3–2),
(2–1) and (1–0) spectra are plotted in black, red and magenta, respectively. For
the
(3–2),
(2–1) and (1–0) spectra are plotted in black, red and magenta, respectively. For
the  spectra the
colours are green, blue and cyan. The and
(3–2)
spectra are plotted as histograms. Note the different temperature scale in the
uppermost row.
spectra the
colours are green, blue and cyan. The and
(3–2)
spectra are plotted as histograms. Note the different temperature scale in the
uppermost row.
Current usage metrics show cumulative count of Article Views (full-text article views including HTML views, PDF and ePub downloads, according to the available data) and Abstracts Views on Vision4Press platform.
Data correspond to usage on the plateform after 2015. The current usage metrics is available 48-96 hours after online publication and is updated daily on week days.
Initial download of the metrics may take a while.