Fig. 4
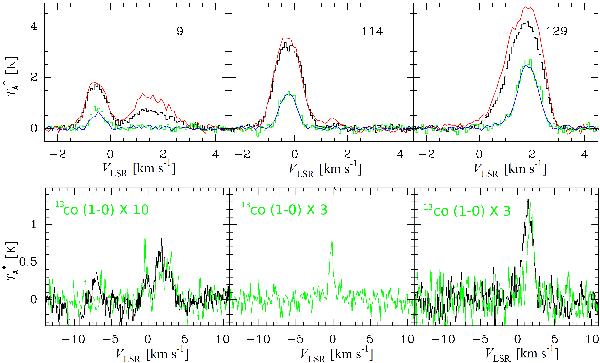
Examples of spectra obtained with APEX (upper panels) and at OSO (lower panels) for globulettes of different size. From left to right: RN 9 (small), 114 (medium), and 129 (large). Upper panels: the 12CO(3–2), 13CO(3–2), 12CO(2–1), and 13CO(2–1) lines are plotted in black, green, red, and blue, respectively. Lines from (2–1) transitions are drawn as curves, and from (3–2) transitions as histograms. Lower panels: 12CO(1–0) profiles (thick); 13CO(1–0) profiles (green, thin). The 13CO(1–0) lines are multiplied by ten (RN 9) or three (RN 114 and 129). RN 9 is identified with the narrow component at ~0 km s-1, while the broader component at ~+2 km s-1 comes from more extended gas. In RN 129 a “blue” wing is present in several lines.
Current usage metrics show cumulative count of Article Views (full-text article views including HTML views, PDF and ePub downloads, according to the available data) and Abstracts Views on Vision4Press platform.
Data correspond to usage on the plateform after 2015. The current usage metrics is available 48-96 hours after online publication and is updated daily on week days.
Initial download of the metrics may take a while.