Fig. 6
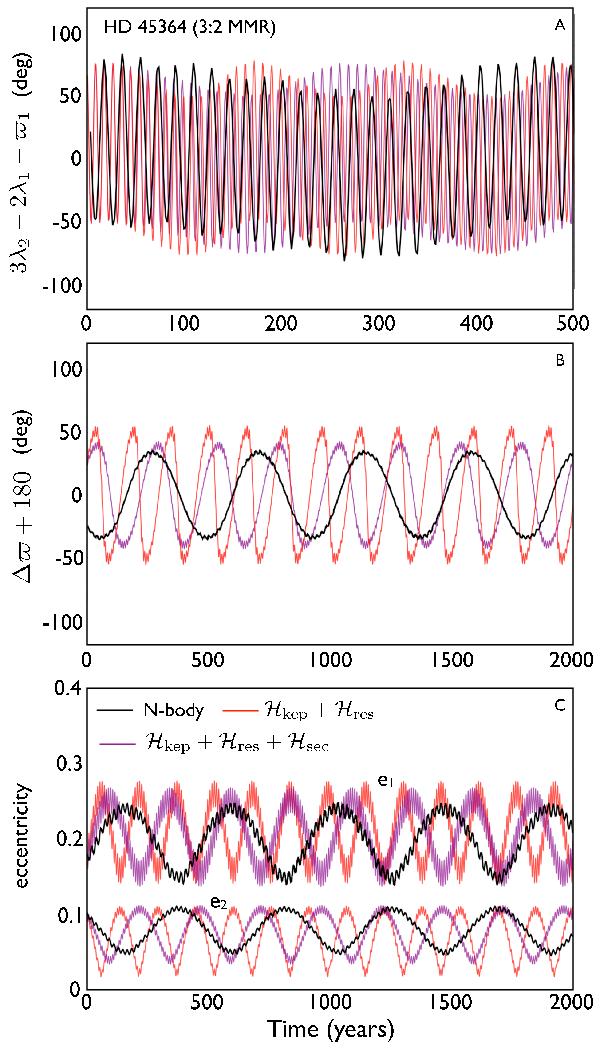
Dynamical evolution of the Correia et al. (2009) resonant fit at various levels of approximation. The black curve corresponds to the solution obtained with numerical N-body integration software (that is by direct integration of the Hamiltonian (1)). The red curves are given by the integrable Hamiltonian (29). The purple curves depict the dynamical evolution derived from the nonintegrable Hamiltonian (48). Following Correia et al. (2009), panel A shows the evolution of resonant argument 3λ2 − 2λ1 − ϖ1. Panel B shows the evolution of the apsidal angle Δγ. Panel C shows the eccentricities as functions of time. The evolution of the second resonant argument, 3λ2 − 2λ1 − ϖ2, can be re-constructed by combining the evolution of 3λ2 − 2λ1 − ϖ1 with that of Δγ.
Current usage metrics show cumulative count of Article Views (full-text article views including HTML views, PDF and ePub downloads, according to the available data) and Abstracts Views on Vision4Press platform.
Data correspond to usage on the plateform after 2015. The current usage metrics is available 48-96 hours after online publication and is updated daily on week days.
Initial download of the metrics may take a while.