Fig. 9
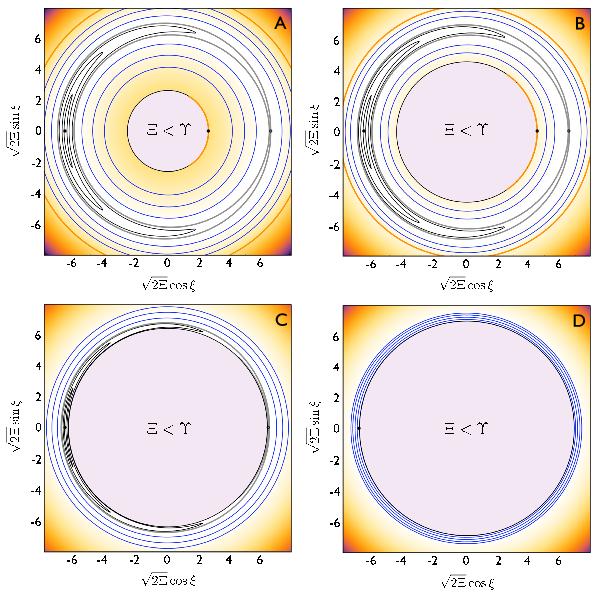
Level curves of a frozen system given by the Hamiltonian (48). The energy levels are plotted in the (Ξ,ξ) plane, freezing the second (slow) degree of freedom at Υ = const.,υ = 0. Panels A)–D) are characterized by the same values of Υ (that is, Ψ2) as those shown in Fig. 3. The inadmissible region that arises once the Hamiltonian is formulated in terms of action-angle variables (47), is shown in light purple. Otherwise, the color scheme of the curves is the same as that shown in Fig. 3.
Current usage metrics show cumulative count of Article Views (full-text article views including HTML views, PDF and ePub downloads, according to the available data) and Abstracts Views on Vision4Press platform.
Data correspond to usage on the plateform after 2015. The current usage metrics is available 48-96 hours after online publication and is updated daily on week days.
Initial download of the metrics may take a while.