Fig. 4
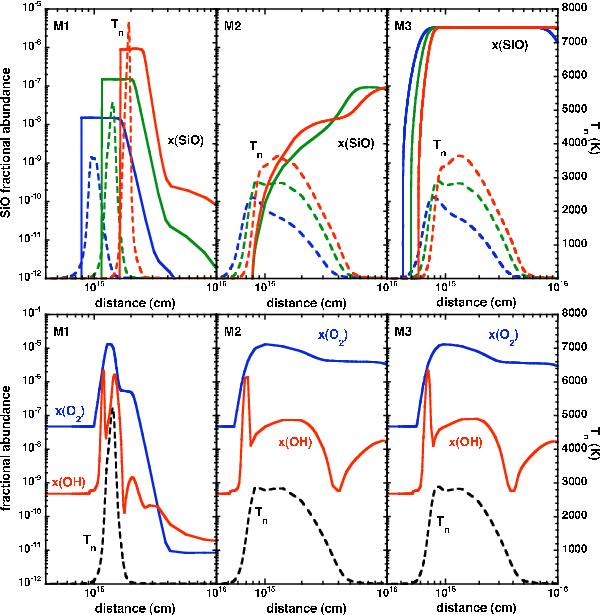
Upper panel: evolution of the fractional abundance of SiO in the gas phase (left ordinate, full curves) and temperature of the neutral fluid (right ordinate, broken curves). From left to right: dust modelling scenarios M1, M2, and M3. The models shown in all three panels are for Vs = 20 km s-1 with b = 1.0 (blue), Vs = 30 km s-1 with b = 1.5 (green), and Vs = 40 km s-1 with b = 2.0 (red). The fractional abundance of SiO in the gas phase is negligible for Vs = 20 km s-1 with b = 1.0 in scenario M2. Lower panel: variation through the shock wave of the gas-phase fractional abundances of O2 (left ordinate, full blue curves) and OH (left ordinate, full red curves), together with the temperature of the neutral fluid (right ordinate, black broken curves), for Vs = 30 km s-1 and b = 1.5 and each of the dust models M1, M2 and M3 (from left to right).
Current usage metrics show cumulative count of Article Views (full-text article views including HTML views, PDF and ePub downloads, according to the available data) and Abstracts Views on Vision4Press platform.
Data correspond to usage on the plateform after 2015. The current usage metrics is available 48-96 hours after online publication and is updated daily on week days.
Initial download of the metrics may take a while.