Fig. 3
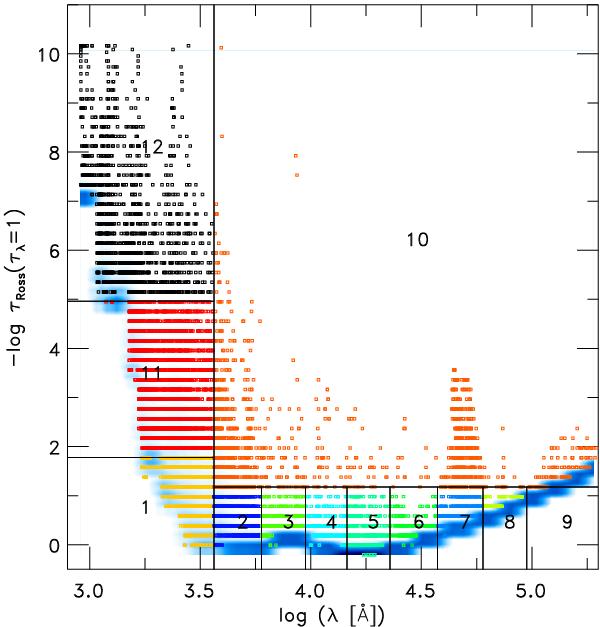
Twelve opacity bins selected for the solar simulation by plotting the opacity strength (or, more precisely, the formation height) against wavelength for all sampled wavelength points. The individual bin elements are indicated by colored symbols. For clarity, we plotted only a subset of the wavelength points considered for the opacity binning procedure. In the background, we included the smoothed histogram of the opacity strength distribution (blue contour). This shows how the majority of λ-points are mostly concentrated close to the continuum-forming layers and only a smaller fraction contributes to lines.
Current usage metrics show cumulative count of Article Views (full-text article views including HTML views, PDF and ePub downloads, according to the available data) and Abstracts Views on Vision4Press platform.
Data correspond to usage on the plateform after 2015. The current usage metrics is available 48-96 hours after online publication and is updated daily on week days.
Initial download of the metrics may take a while.